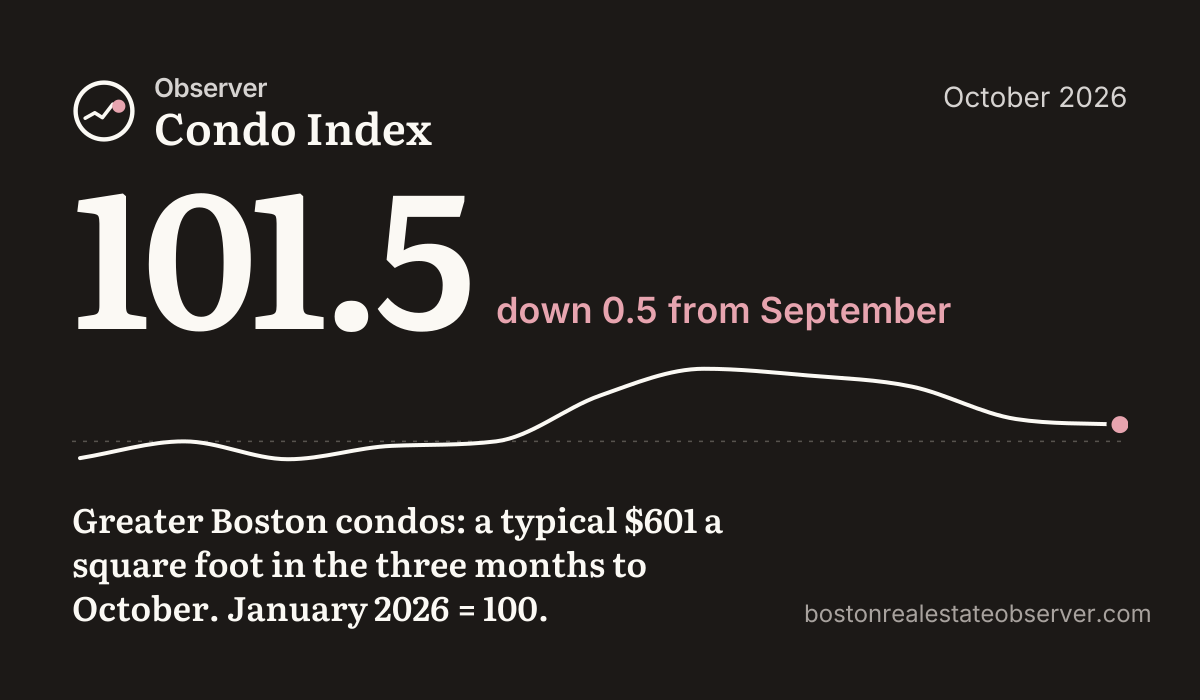
Greater Boston condos sold for a typical $601 a square foot in the three months to October.
The Observer Condo Index stands at 101.5 for October 2026 (January 2026 = 100), down 0.5 from September. In October, 38% of the 621 condos that sold went for their first asking price or more.
Key factsAs of November 10, 2026
- The Observer Condo Index for October 2026 is 101.5 (January 2026 = 100): in the three months to October 2026, the typical Greater Boston condo sold for $601 a square foot.
- In October 2026, 621 condos sold in Greater Boston for a typical $710,000, after a median 18 days to an accepted offer.
- 38% of Greater Boston condos sold in October 2026 went for their first asking price or more.
- The index is down 0.5 from September (102.0).
- In the week of Nov 2, 3,089 condos were for sale across Greater Boston and 122 went under agreement.
- Among towns with 40 or more condo sales in each period, price per square foot rose most in Boston (+4.5%) and fell most in Quincy (-7.5%), latest 3 months against the 3 before.
Cite as: “Observer Condo Index, October 2026,” Boston Real Estate Observer, https://bostonrealestateobserver.com/condo-index/ (verified market data as of November 10, 2026).
Condo prices per square foot are 1.5% higher than in January 2026
Observer Condo Index: the typical sale price per square foot of Greater Boston condos sold in each month and the two before it. January 2026 = 100.
Show the numbers
| Month | Index | Per sq ft, 3 months | Per sq ft, month | Sales | Typical price | Days to offer | At or above asking |
|---|---|---|---|---|---|---|---|
| December 2025 | 98.5 | $583 | $571 | 746 | $671,500 | 28 | 29% |
| January 2026 | 100.0 | $592 | $614 | 497 | $748,500 | 33 | 30% |
| February 2026 | 98.4 | $583 | $568 | 460 | $675,000 | 30 | 35% |
| March 2026 | 99.6 | $590 | $585 | 630 | $699,900 | 16 | 42% |
| April 2026 | 100.0 | $592 | $613 | 782 | $740,000 | 12 | 51% |
| May 2026 | 104.1 | $617 | $632 | 932 | $750,000 | 10 | 50% |
| June 2026 | 106.5 | $631 | $638 | 1,133 | $745,000 | 11 | 47% |
| July 2026 | 105.9 | $628 | $611 | 1,056 | $700,000 | 16 | 40% |
| August 2026 | 104.9 | $621 | $612 | 818 | $723,000 | 21 | 36% |
| September 2026 | 102.0 | $604 | $580 | 632 | $659,000 | 27 | 29% |
| October 2026 | 101.5 | $601 | $600 | 621 | $710,000 | 18 | 38% |
Buyers took a typical 18 days to agree on a Greater Boston condo in October
Median days from listing to an accepted offer, condos sold each month.
Show the numbers
| Month | Days to an accepted offer | Sales |
|---|---|---|
| December 2025 | 28 | 746 |
| January 2026 | 33 | 497 |
| February 2026 | 30 | 460 |
| March 2026 | 16 | 630 |
| April 2026 | 12 | 782 |
| May 2026 | 10 | 932 |
| June 2026 | 11 | 1,133 |
| July 2026 | 16 | 1,056 |
| August 2026 | 21 | 818 |
| September 2026 | 27 | 632 |
| October 2026 | 18 | 621 |
3,089 condos are for sale across Greater Boston, up from 2,877 in the week of Aug 10
Condos for sale at the end of each week, 47 Greater Boston cities and towns.
Show the numbers
| Week of | For sale | Went under agreement | New listings |
|---|---|---|---|
| Aug 10 | 2,877 | 147 | 201 |
| Aug 17 | 2,808 | 134 | 164 |
| Aug 24 | 2,782 | 110 | 171 |
| Aug 31 | 2,488 | 128 | 143 |
| Sep 7 | 2,977 | 103 | 671 |
| Sep 14 | 3,224 | 182 | 508 |
| Sep 21 | 3,306 | 173 | 332 |
| Sep 28 | 3,305 | 154 | 400 |
| Oct 5 | 3,363 | 154 | 310 |
| Oct 12 | 3,417 | 127 | 277 |
| Oct 19 | 3,378 | 147 | 206 |
| Oct 26 | 3,127 | 156 | 218 |
| Nov 2 | 3,089 | 122 | 248 |
Town by townPast 12 months, towns with 30+ condo sales
| Town | Sales | Typical price | Per sq ft | Days to offer | At or above asking | Per sq ft, last 3 months vs 3 before |
|---|---|---|---|---|---|---|
| Boston | 3,419 | $785K | $809 | 22 | 35% | +4.5% |
| Cambridge | 542 | $950K | $921 | 14 | 45% | -6.4% |
| Somerville | 408 | $850K | $747 | 13 | 47% | -3.1% |
| Brookline | 386 | $1.04M | $822 | 15 | 37% | +0.6% |
| Quincy | 317 | $500K | $477 | 13 | 43% | -7.5% |
| Newton | 316 | $1.08M | $559 | 19 | 35% | -0.7% |
| Salem | 262 | $515K | $429 | 16 | 44% | -4.0% |
| Watertown | 224 | $720K | $526 | 13 | 47% | +3.3% |
| Arlington | 213 | $881K | $622 | 8 | 55% | -4.0% |
| Medford | 185 | $685K | $525 | 19 | 37% | -3.8% |
| Weymouth | 156 | $375K | $379 | 14 | 40% | +1.9% |
| Waltham | 153 | $660K | $495 | 16 | 42% | +1.3% |
| Revere | 146 | $430K | $453 | 25 | 32% | -4.4% |
| Natick | 144 | $440K | $438 | 13 | 36% | +3.4% |
| Lynn | 144 | $380K | $372 | 25 | 42% | +0.4% |
| Framingham | 122 | $345K | $357 | 21 | 34% | -8.7% |
| Woburn | 114 | $579K | $464 | 14 | 43% | +2.6% |
| Canton | 108 | $608K | $429 | 13 | 54% | +11.0% |
| Winthrop | 93 | $512K | $475 | 20 | 37% | -6.5% |
| Wakefield | 92 | $629K | $533 | 18 | 49% | +10.5% |
| Chelsea | 90 | $450K | $433 | 28 | 27% | -13.9% |
| Stoneham | 88 | $425K | $432 | 11 | 47% | +5.5% |
| Malden | 85 | $430K | $467 | 15 | 49% | -10.1% |
| Peabody | 83 | $485K | $369 | 14 | 49% | – |
| Braintree | 79 | $475K | $424 | 20 | 28% | -7.6% |
| Reading | 66 | $620K | $453 | 11 | 56% | – |
| Melrose | 65 | $555K | $475 | 9 | 58% | – |
| Marblehead | 59 | $599K | $549 | 17 | 39% | – |
| Winchester | 56 | $948K | $533 | 8 | 57% | – |
| Swampscott | 55 | $479K | $402 | 11 | 42% | – |
| Everett | 52 | $465K | $467 | 19 | 46% | – |
| Needham | 52 | $1.11M | $514 | 36 | 27% | – |
| Bedford | 50 | $950K | $458 | 11 | 46% | – |
| Belmont | 50 | $860K | $578 | 12 | 38% | – |
| Wellesley | 50 | $1.25M | $738 | 15 | 34% | – |
| Dedham | 46 | $501K | $480 | 23 | 52% | – |
| Norwood | 46 | $489K | $390 | 16 | 50% | – |
| Saugus | 45 | $552K | $361 | 21 | 38% | – |
| Milton | 43 | $740K | $570 | 27 | 44% | – |
| Concord | 41 | $820K | $555 | 19 | 29% | – |
| Wayland | 40 | $805K | $375 | 12 | 57% | – |
| Lexington | 37 | $1.05M | $546 | 24 | 51% | – |
Last 3 months = the three complete months to October 2026. Shown where both periods have 20+ sales. See the busiest condo buildings.
Quote the indexFree to use, with credit
A sentence, ready to use
The Observer Condo Index stood at 101.5 in October 2026 (January 2026 = 100), down 0.5 points from September, according to the Boston Real Estate Observer. Greater Boston condos sold for a typical $601 a square foot in the three months to October.
How to credit it
“Observer Condo Index, October 2026,” Boston Real Estate Observer, https://bostonrealestateobserver.com/condo-index/ (verified market data as of November 10, 2026).
The chart on your site
Paste this code where you want it. It updates itself every month.
<iframe src="https://bostonrealestateobserver.com/embed/condo-index/" title="Observer Condo Index" width="100%" height="520" style="border:0" loading="lazy"></iframe>Every month since January 2026 as data: /condo-index/data.json. Quoting a number from a past month? Use that month's edition, which never changes.
How the index works
Every condo sale in 47 Greater Boston cities and towns (the same area as our building rankings), from verified market data, grouped by the month it closed. The index is the typical (median) sale price per square foot of every sale in the latest three months, pooled, so one month's mix of luxury and starter units can't swing it. It is divided by the same figure for January 2026 and multiplied by 100. Price per square foot uses the living area filed with each sale; units under 200 square feet are left out. Only complete months count. The recipe never changes, so any month can be compared with any other.
The Observer, in your inbox every Tuesday morning. Free.
What the agentic newsroom found this week: prices, zoning, rents and the towns changing fastest.
Add your town and each email includes its figures. Unsubscribe anytime. Privacy.