New distressed debt numbers from the banking sector have recently been published, so it is time again to take a look at the 181 banks that make up our local lending landscape. There is a lot of talk about a very serious forthcoming correction in commercial real estate and the effects that this will have on our financial institutions. New numbers indicate, however, that Massachusetts lenders may be set to dodge this bullet… at least to some degree.
Overall, Massachusetts banks saw an increase in their distressed real estate balances of only about 5% Q2-Q3 2009. I don’t know if this sounds like a lot or a little to you, but compared to the US totals at 11% its not too bad. Still, distress totals are up 72% over the last four quarters, not a confidence-inspiring figure.
This quarter is the first quarter that two Massachusetts banks are reporting capital adequacy numbers below those deemed healthy. In lay terms, capital adequacy has to do with the ratio of what you’ve got in the vault to what you’ve got on the street. Tier 1 + Tier 2 capital to risk weight adjusted assets should be no lower than 8%. One of these banks, Mt Washington Bank, recently announced a merger with East Boston Savings Bank, which, while reporting a little less than $20 Million in non-accrual loans and a little more than $2.5MM in (mostly construction) REO, is well capitalized reporting a ratio of 14% compared to Mt Washington’s 6%.
The other bank of note is Butler Bank. Butler reported capital adequacy ratios at 2% and 3%, a far cry from the 4% and 8% that regulators like to see. Butler’s construction portfolio has gone south at a rate of almost 40% (39.59%) and is by every measure the main source of their ills. It has been reported Boston Business Journal that the bank is being closely monitored by the FDIC.
Overall, Massachusetts banks saw the following changes from Q2 to Q3.
- 15% increase in residential distress, largely driven by REO
- 3.26% increase in distressed multifamily
- Unchanged (virtually) commercial real estate distress
- Unchanged (less than 1%) construction distress
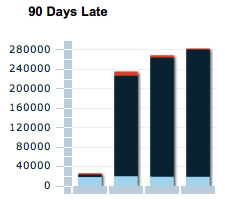
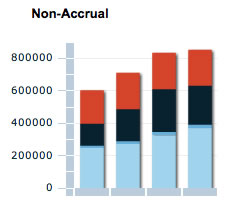
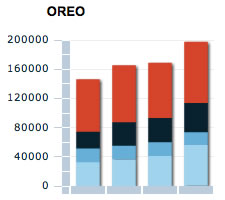
The distressed real estate totals are calculated by adding a bank’s 90+day late loans, non-accrual loans, and REO (bank-owned property). It appears that we may be getting over the hump with construction loans, both locally and nationally, but that doesn’t mean that banks have dealt with the construction problems at hand only that most of the problems are already in the system. For example, while non-performing construction loans with Mass. banks fell by 2% to $222M construction REO (bank-owned) grew from $75.7M to $84M.
There are strong indicators that many, if not most, banks (with problems) are postponing inevitable losses as they move paper around internally. At some point, that will have to stop, and distressed properties will have to be sold. Today, Massachusetts-based banks are holding about $1.33 billion in distressed real estate loans and property. About two-thirds of that is residential, construction, and multifamily, while the balance is commercial. It’s important to remember that the numbers I’m giving you do not represent the whole of the distressed real estate market in Massachusetts. But only the numbers held at Massachusetts-based banks. That means Bank of America, Citi, Deutsche Bank, and all of the largest lenders’ numbers, as well as mortgage-backed securities are unrepresented.