Downtown Residential Market Status

After moving through June, traditionally one of the most active months of the year for real estate transactions, the downtown Boston residential real estate market shows interesting signs of vitality.

Over the course of 2007 to 2009, during the month of June, the number of listings that sold (see table immediately below) in downtown Boston has steadily decreased, along with average list and sale price.  Sale to list price ratio has remained relatively steady in the mid 90 percentile, in part meaning that homes continue to be priced by Sellers in line with the expectations of Buyers, albeit, on average, lower.

june-sold-stats

The amount of time that a property is remaining on the market, however, has been decreasing year over year.  And if we look at a snapshot of what homes are/were on the market in June of each year from 2007 through 2009 (see table immediately below), inventory levels are staying relatively steady (with a slight increase).  The average list price for a home in downtown Boston has trended up, yet this is largely a function of multiple $10 million + properties that are on the market currently.

on-market-snapshot

While the data herein represents an admittedly small slice of current market conditions, and thus it’s dangerous to make too many far reaching assumptions based off of a cursory analysis, some insight is provided.   Rather than focus on (the decline of) average list and sale price of homes in downtown Boston, a figure that can be swayed by a potentially unrepresentative mix of homes actually sold during the analysis, let us key in on the average days on market (DOM), along with inventory levels, and sale to list price ratio.  The amount of choice Buyers have on the market is as good as it has been in several years, however, homes are being priced relatively accurately (in the context of what Buyers are willing to pay versus the expectations of what Sellers are willing to list at), and relatively speaking, units are selling faster than they have over the past several years.

Data was compiled using the Boston MLS (MLSpin) across the downtown Boston neighborhoods of Back Bay, Beacon Hill, Financial District, Leather District, Midtown, North End, Seaport District, South Boston, South End, Fenway, Theatre District, Waterfront, and West End.

Downtown Boston Market Slows in Piecemeal

In looking at November 2008 sales statistics for downtown Boston, the number of listings that sold in the month has decreased substantially from the same time period in 2007, while prices flashed various signals in different market segments, both up and down.

The downtown Boston market slowed (in terms of number of units sold) year on year in November by approximately 34%, moving from 196 condos sold in 2007 to 130 in 2008.  The bulk of that percentage slowdown comes from a 59% drop in the number of $1 million + homes that were sold, versus a drop of 28% in the under $1 million market.  Various downtown neighborhoods have experienced a slowdown at different magnitudes, the South End for instance, has shown to be slowing less than the overall market (see South End Market Slows Down, Well…Maybe).

In the month of November, average and median prices of homes sold increased by 4% and 7% respectively in the under $1 million market year over year, while luxury homes over $1 million saw average and median prices decrease by 16% and 9% respectively.

Performance in the $1 million + market has impacted overall trends, however, it’s interesting to note that homes in this price range have accounted for only 10% – 17% of the overall November market of sold homes in 2007 and 2008.

South End Market Slows Down, Well…Maybe

We’ve received some questions lately specific to the South End condo market, most notably, how are things going?  The main claim that we have been hearing on the street is that the market has “slowed down” and also that “prices are falling”.  Speaking with local real estate experts who specialize in the downtown Boston real estate market can be helpful, but viewpoints can oftentimes be swayed by current personal success and business level, so that’s why it’s a good idea to take a look at the cold hard facts and draw conclusions straight from there.

We’ve tried to take an objective look at things by focusing on the past three months of data (i.e. August to October) in each of the past five years.  Any impact from the significant financial issues that many US investment banks have played a part in creating, and are experiencing, and the fallout that these actions are creating for the remainder of the country will most notably be felt in later months of this year (from a real estate perspective), bearing in mind that most of the units that closed in October of this year, were Under Agreement some 30 – 45 days before their closing date.  That said, while the analysis that we are about to walk through represents a data-driven look at the South End market, it may not be entirely “current”, as there are natural lag times built into looking at real estate information, much like any national economic report.

Note that all information has been pulled from the Boston MLS.

South End Condo Sales Statistics

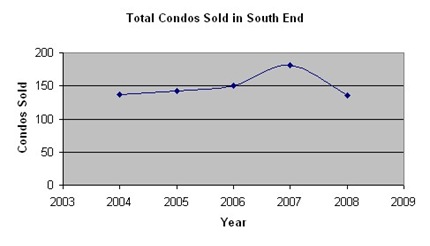
The first thing we will look at is the number of units that sold year over year.  With this particular statistic, the number of condos that sold in the South End in 2008 (135) during the time period we analyzed decreased by approximately 25% from numbers the neighborhood pushed during the same period in 2007 (181) –  a definite slow down. The 2008 number is slightly below the 5 year average (149).

Number of Condos Sold in South End

South End Median & Average Home Prices

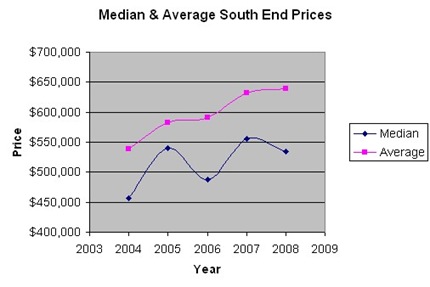
The only other “negative” statistic is median home price, which decreased approximately 3.6% from $555,000 in 2007 to $535,000 in 2008.  A median home price decrease was countered by a slight 1% increase in average sold price.  Keep in mind why we look at both median and average prices – when looking at housing statistics, be careful not to only focus on averages, also consider median values (the number in the middle of your data set), because averages can be pulled significantly one way or the other with only a small number of outlying data points.

South End Median & Average Home Prices

South End Available Condos for Sale (Inventory)

The other notable statistic, from a significant change perspective, is  inventory (i.e. how many condos are available for sale at any given time).  2008 inventory levels have decreased approximately 14% from what we saw in 2007 during the same period, and 2008 inventory is the lowest the city has seen since 2004.  Combined with an average days on market of approximately 80 (which is a steady decrease since five year highs in 2006), and you have characteristics of what some might call a Seller’s market.

Selling price to original listing price ratios have stayed very strong for South End condos over the past 5 years, currently at 96%, with a five year average of 97%.  As well, the million dollar + market has stayed stable over the past 3 years since a significant jump in the number of million dollar homes took place in 2006.

While the sheer number of for sale condos sold in Boston’s South End has decreased quite markedly from 2007 during the 3 month period we analyzed, median prices in the South End have stayed relatively steady and average prices have increased slightly.  Inventory levels have decreased and Sellers are getting very close to the prices that their homes are being listed for (the original price itself, not after price reductions, if any).  Regardless of the reasons behind Sellers listing their condos for sale, we’re not seeing evidence of “fire sales”, perhaps a testament to the quality of the South End as a neighborhood, and a destination for those who call Boston home. And while the market (when speaking about the number of condos being sold) has indeed slowed, the surrounding statistics paint a picture of a currently stable neighborhood.

Boston Sales to List Price Ratio

As we wind into the final months of the summer real estate season, we wanted to take a look at what happened over the past month specific to sales to list price ratio (i.e. the sales price represents what percentage of the list price). If the value is equal to 100%, a Buyer offered full asking price, if the percentage is less than 100%, than the Buyer got an accepted Offer by offering less than the full asking price.

  • 286 properties sold between July 31, 2008 and August 31, 2008 (according to the Boston MLS)
  • The sales to list price ratio was 97% (96.67%)
  • 241 sales were below list prices (84% of all sales)
  • 17 sales were at full asking prices(6% of all sales)
  • 28 sales were above list prices(10% of all sales)
  • Neighborhoods included: Back Bay, Beacon Hill, Financial District, Leather District, Midtown, North End, Seaport District, South Boston, South End, The Fenway, Theatre District, Waterfront, West End

The two condos that garnered the highest sales price related to its list prices were 10 Hanover Avenue Unit 3 in the North End, which as a short sale, was listed at $274,900, but sold at $365,000 ($529 per square foot).  And 67 Rutland Street Unit 1 in the South End, a 2 bedroom 2.5 bathroom condo that was listed at $649,000 and sold at $715,000.

On the other end of the scale, 40 Battery Street Unit 305 was listed at $2,300,000 and sold for 1,950,000 on August 1, 2008 in the North End Waterfront. And 215 Commonwealth Avenue Unit 3 in the Back Bay was listed at $2,100,000 and sold for $1,795,000.

When making an Offer on a condo, some might say “how strong of an Offer do you want to make?” with the assumption that being closer to 100% of list price is strong, obviously, this needs to be taken in context.

Several takeaways may include:

  • Short sales typically represent the “bargain” that some are looking for in a list price, at least on paper, but given that they are few and far between in the core of downtown Boston, the eventual sales price, despite all the extra hoops, may not translate into an actual bargain
  • There is a decent percentage of the market that is being accurately priced at the time of listing, and Buyers are recognizing this, and willing to compete for a property by offering full asking price or above. A comprehensive comparable market analysis (as well as other factors)  is needed to feel confident in offering above list price.
  • Of the 26 high end condos ($1 million +) that sold in the period, 5 of them sold for above asking price (Wilkes Passage and 249 Beacon Street for example) , while 21 sold for below (Burroughs Wharf, The Prince, and One Charles for example).  Perhaps there is more room to negotiate at the high end if the comparables warrant it.

Beacon Hill Average Price per Square Foot

Our analysis of average price per square foot values in downtown Boston neighborhoods continues with Boston’s Beacon Hill, one of the most prestigious areas of the city to call home. Beacon Hill prices command a premium over some of the other neighborhoods that we have looked at, however, prices are in line with such neighborhoods as the Back Bay and the South End.

Thus far in 2008, according to the Boston MLS, the average price per square foot on Beacon Hill has been approximately $731 (median of $708). The data range, covering roughly 102 condos, runs from $494 to $1,283 per square foot. The lowest being $494 per square foot at 45 Mount Vernon Street Unit 1C, a 1,570 square foot two-bedroom two-bathroom unit. The average price per square foot of $731 is characteristic of Unit 9 at 1 Garden Street, a 630 square foot one-bedroom that sold for $460,000 in May after being on the market for approximately 62 days with an original listing price of $469,900. The high end was at 108 Mount Vernon Street Unit 5, a 2,128 square foot three-bedroom three-bathroom unit with a full floor, four-sided exposure and five bay windows that sold in May for $2,730,000 ($1,283 per square foot).

North End Average Price Per Square Foot

Our analysis of average price per square foot values in downtown Boston neighborhoods continues with Boston’s North End. Price per square foot, as we will see, is in line with the rest of the city, however, the one significant difference that we are seeing year on year with the North End is the number of units sold. January to July 2007 saw approximately 53 condos sold in the North End, while the same time period for this year has seen only 34 sold, a substantial difference.

Nonetheless, in 2008, the average price per square foot in the North End has been approximately $578 (median of $562). The data range, covering nearly 34 condos, runs from $327 to $885 per square foot. The lowest being $327 per square foot at 21 Moon Street Unit 4, a 726 square foot condo in need of renovation work. The average price per square foot of $578 is characteristic of Unit 2 at 10 Sheafe Street, a 529 square foot 1+ duplex that sold for $305,000 in April after being on the market for approximately 140 days. The high end was at 44 Prince Street Unit 501, a 1,150 square foot three-exposure unit in the new high-end development that sold in May for $995,000 ($885 per square foot).

The North End, and almost all downtown neighborhoods that border the Waterfront area, can oftentimes be a little skewed when looking at the data because there is no consistent way in which real estate agents code the condos they are selling (i.e. one agent may code a property North End, while another may have coded a similarly located property Waterfront). As with any statistics, you need to understand the limitations of the data and factors that could impact the numbers, such as the aforementioned location issue.

Note: data pulled from the Boston MLS.

South End Average Price Per Square Foot

As we turn towards the second half of the year, and Sellers deliberate listing their condos for sale, one of the questions we receive most often revolves around what a realistic price per square foot is in various downtown Boston neighborhoods. This type of information is also very useful for Buyers to have as well, to help set expectations about what realistic price points are in particular neighborhoods.

In 2008, the average price per square foot in the South End has been approximately $613 (median of $612). The data range, covering nearly 300 condos, runs from $340 to $997 per square foot. The lowest being $340 per square foot at 162 Appleton Street Unit 1, a large garden level unit that sold in March after being on the market for an accumulated year of activity. The high end was at 290 Columbus Avenue Unit 3, a 316 square foot pied-a-terre that sold after only 24 days on the market (Note: data pulled from the Boston MLS).

We’ll continue to look at the other downtown Boston neighborhoods, all of which we provide assistance in both helping Sellers list their condo for sale, and Buyers purchase the right condo for their needs. When looking at housing statistics, be careful not to only focus on averages, also consider median values (the number in the middle of your data), because averages can be pulled significantly one way or the other with only a small number of outlying data points.

Boston Real Estate Market Talking Points

The Greater Boston Real Estate Board (GBREB) recently published seven talking points regarding the Boston (specifically “greater” Boston, which involves suburbs outside the core downtown) real estate market. All of them are quite interesting, and could be approached and/or discussed from many angles. Here they are:

  1. The past year was the fifth best on record for residential home sales in Greater Boston with more than 20,000 detached single-family homes and condos sold in 2007. After declining in 2006, sales of detached homes and condos each rose modestly last year in Greater Boston, making it the only region of the state to report an increase in sales activity over the prior year, according to Boston MLS data.
  2. While home prices declined nationally in 2007 and have fallen in much of Massachusetts for the past two years, home values have stabilized in Greater Boston as the median selling price for detached single-family homes was unchanged at $480,000 in 2007 from one year earlier. Meanwhile, in the condo market, the median price for sold units rose a modest 4 ½ percent to $356,000 in 2007.
  3. Despite the recent correction in home prices, housing is a solid long-term investment. In fact, median home prices in Greater Boston have increased an average of 6.5% per year over the past decade, and remain 20% higher than they were just five years ago ($480,000 in 2007 vs. $400,400 in 2002).
  4. The inventory of unsold homes remains plentiful at many price points, but the supply of single-family homes and condos has shrunk substantially in the past year by 14 percent. At the end of 2007, there was a 6 ½ month supply of homes and condos for sale in greater Boston real estate compared to a nearly 8 months in 2006, indicating the market has become more balanced between buyers and sellers over the past year.
  5. Massachusetts ranks among the bottom five states nationally for annual housing permits per capita, largely due to strict zoning regulations that limits new housing production. This fact, along with strong housing demand from a large immigrant population locally and much more modest real estate investor activity in Greater Boston in recent years should insulate the region from any severe price correction.
  6. When looking to buy, it’s virtually impossible to time the market. With mortgage rates having declined and now averaging near 6 percent for a 30-year fixed loan, home prices having stabilized locally, and many homeowners motivated to sell, this spring should be a good time to buy.
  7. Although mortgage lenders have tightened lending standards, financing remains readily available for creditworthy borrowers. Importantly, however, consumers with credit scores under 680 can expect to pay higher rates and points this spring following pricing changes that Fannie Mae and Freddie Mac will impose in March. Thus, those currently in the market may wish to act sooner rather than later to buy.

Boston Condo Pricing Breakdown

We recently received some year-end positive comments from readers, with one of them inquiring if we can spend a little bit more time on a go-forward basis covering Boston condos that are less than $500,000. This is definitely a fair request, and we will strive to cover interesting Boston condo happenings, regardless of price points, as well as other happenings in Boston of note.

The specific request to give further coverage to the segment of the Boston market under $500K gives rise to an interesting question: What is the current breakdown of listings (prices) in Boston? We took to answering this question, looking specifically at the core downtown neighborhoods (specifically, Back Bay, Bay Village, Chinatown, Financial District, Leather District, Midtown, North End, Seaport District, South End, Theatre District, Waterfront, West End).

We broke listings down into large sections of prices to gain a high-level view of the market:

  • Less than $500,000 (< $500K) – 25%
  • $500,000 to $1 Million – 43%
  • More than $1 Million (> $1 Million) – 32%

Condos that are listed for less than $500,000 represent only 25% of all current listings on the market. The majority of condos in Boston are priced between $500,000 and $1 million. 32% of the core downtown Boston market is made up of condos priced over $1 million.

The Back Bay is home to the most expensive listings, with 103 condos priced over $1 million. The Back Bay has almost three times the number of million dollar listings the South End and the Waterfront separately boast.

For full details, see the Boston Condo Pricing Breakdown (PDF).

Trulia Says Boston Real Estate is Hot

Thanks to John Keith for pointing out that the Trulia Blog is passing out some warm and fuzzy news about the Boston real estate market. According to the Trulia September 2007 Trends Report, the downtown Boston market is experiencing year-on-year gains in home prices.

Median sales price in Back Bay is up 18.2 percent over last year, showing that some areas have defied the real estate slump. South End was next on the list of most popular neighborhoods. Densely populated South Boston, or “Southie”, was third most popular. Median sales price in South End and South Boston was up 8.8 percent and 7.2 percent, respectively, over the previous year.

This confirms what we have been saying for some time now, that city center condo prices buck the suburb and pan-US housing trends.

=== Updated on October 24, 2007 ====

Based on the comments we received, here is a look into deeper statistics for the Back Bay market from 2005 – 2007.

From 2005 – 2006:

  • Average Price: $819,339
  • Average Days on Market: 101
  • Number of Units Sold: 387

From 2006 – 2007

  • Average Price: $865,507
  • Average Days on Market: 111
  • Number of Units Sold: 453

These numbers are based off of data pulled from the MLS (Back Bay 2005 – 2006 and Back Bay 2006 – 2007). Over the past two years in the Back Bay, the number of condos sold has gone up significantly, average days on market has trended up, and average price continues to trend up.