Housing and Buying Inventory Finally Opening Up in Boston

For the last few years, there has been a repetitive chorus about low inventory in Boston’s housing market. In mid-2014, CNBC labeled the extended trend as a “severe inventory shortage,” and last August, Boston Agent magazine went so far as to report that “housing inventory never rises in Greater Boston.”

However, there are now signs of change appearing in the market. At the end of October 2015, the Greater Boston Association of Realtors (GBAR) reported that inventory levels are finally starting to slowly creep upward. Here are some market indicators to support that observation:

  • In September 2015, the decline in the number of single-family homes and condos for sale was smaller than for any other month of the year.
  • That trend resulted in the number of home listings dropping 10 percent and condo listings dipping 6.4 percent.
  • New listings rose for both detached single-family homes and condos, with improvement on both a year-to-year and month-to-month basis.
  • The number of homes and condos listed for sale in September 2015 each rose 11 percent compared to September 2014.
  • These numbers climbed even higher from August 2014—by 41 percent or almost 600 homes—in the market for single-family homes. The condo market saw a rise of 56 percent, or approximately 500 units.

“In 2015, Boston added seven major rental apartment communities and over l,800 new apartments to its rental inventory, with more to come in 2016 and 2017,” said Annette Clement, Executive Vice President and General Manager at Furnished Quarters in Massachusetts.  Clement added that the additional apartment inventory also means that Furnished Quarters—the largest provider of temporary furnished apartments in Boston—has been able to find a greater variety of new apartment types and locations for the company’s furnished inventory.

A look at Boston’s luxury market gives a hint of the softening that may be to come for other sectors as well. Curbed Boston reported in September 2015 that up to 2,200 luxury apartments opened in downtown Boston during the year, creating something of a glut in availability of these higher-end units. With so many of such apartments now available, it has now become a tenants’ market, with landlords and brokers scrambling to fill these pricey digs. Evidence of this shift includes a plethora of incentives now being offered to potential renters, from free months to no broker fees.

Why the Change?

To understand further what’s behind the slight turnaround in Boston’s overall inventory, it’s important to evaluate what market forces led to the city’s longstanding shortage of homes and condos in the first place. A few of the reasons that led to the deficit included:

  • Imbalances in new construction. Boston Agent noted in the spring of 2015 that 90 percent of new construction was directed toward rentals, with the majority targeted to multi-family rather than single-family housing. What’s more, new construction, as noted above, has focused mainly on the luxury market, which remains unaffordable for less affluent consumers.
  • Equity issues. RealtyTrac reports that there are still over 7 million homeowners who are delinquent on their mortgage, with millions more remaining too deep underwater to sell their home. It is estimated that around one-third of homeowners currently face such equity issues, which prevents many homes from getting listed.
  • Chicken and the egg. When inventory is low, potential sellers may be reluctant to part with their current home due to fear of not finding a property of comparable quality. If homeowners with the necessary equity and the desire to sell won’t sell their homes for this reason, the inventory stays low.

Fortunately, these forces are beginning to shift. MarketWatch reported in October that “the greater Boston real estate market appears to have reached a level of stability—or altitude—where buyers and sellers can confidently achieve their goals.” GBAR noted that as supply levels begin to build back up, the increased inventory will start to create additional opportunities for buyers.

“When there was a dearth of homes available for sale, many potential buyers chose to live in temporary furnished apartments until they could find just what they were looking to buy,” said Clement. “With the recent increase in inventory, brokers who assist our relocating clients now are having an easier time finding their clients apartment rentals or homes to purchase.”

Such trends are in fact already in the works, as evidenced from the latest pending sales data. September 2015 figures showed that the number of contracted single-family homes increased six months in a row, increasing nearly 30 percent over the past year. This led Boston to a new record-high for September of 1,350 homes placed under contract. Pending sales in the condo market showed similar improvement registering seven straight months of increase, with the number of contracts rising 7 percent during 2015 to 895 in September.

More Housing Opportunities in Boston

With more inventory becoming available throughout Greater Boston, more buyers and renters alike are finding this to be the right time to start thinking about how to take advantage of this growing real estate market. Because competition for housing in Boston remains very high, many considering buying or renting in this area choose to begin with temporary furnished housing.

The search for a permanent residence can often take longer than expected in this part of the country. Having a place to call home during your house hunt that’s conveniently located in the area that you plan to settle down in can ease stress both before and during moves.

The bottom line is, you don’t have to decide today how you want to invest in Boston’s thriving real estate market—you can get to know the city first by starting with short-term apartments in Boston to discover the best neighborhood for you. Call Furnished Quarters at 800-255-8117 to learn more about your options.

Boston Neighborhoods: Time to Buy or Sell?

Much continues to be written in the local and national press about the current state of the “Boston Real Estate Market” since my last article of this nature was published in January 2010 (see Seller vs. Buyer Advantage by Neighborhood). But if you’re a buyer or a seller, you’re more likely to be interested in market data for specific neighborhoods that are of particular interest to you. This article looks once again at market trends for six (6) Boston Neighborhoods: Back Bay, Beacon Hill, Charlestown, Jamaica Plain, South Boston, and South End – based on a 12-month rolling calendar from August 2009 to August 2010 for condos, multi-family homes and single-family homes.

Before you read any further, here are some definitions that will be helpful to you:

  • The Absorption Rate is the number of Active + Pending Listings divided by the number of Sold Listings in a neighborhood.
  • A Seller Advantage Market is one in which there is currently less than a six (6) month supply of homes for sale (i.e. a high absorption rate). Therefore, sellers are less inclined to negotiate a substantially lower offer price (assuming that their home was not “over-priced” to begin with).
  • Conversely, a Buyer Advantage Market is one in which there is currently more than a six (6) month supply of homes for sale (i.e. a lower absorption rate) in which sellers may be more apt to accept a lower price for their home.
  • A Balanced Market is one in which there is exactly a six (6) month supply of inventory. (Please note: If there is no mention made of a property type within a particular price range, it is because there are no, or insufficient, current listings within this category.

All data cited herein was analyzed and compiled by Keller Williams Realty, Boston-Metro from data supplied by the Listing Information Network (LINK), one of two Boston MLS systems.

Back Bay: There is a Seller Advantage Market for condos priced at or below $599K, a Balanced Market for condos priced between $600K and $999K and a Buyer Advantage Market for condos priced at $1M and higher. Multi-family homes are only found above $1M and are in a Balanced Market environment. With respect to single-family homes priced between $750K and $999K, they are found within a Seller Advantage Market. With respect to single-family homes, most are priced at or above $4M and fall under the Buyer Advantage Market category.

Beacon Hill: Condos priced between $250K and $499K, along with those priced between $700K and $1M+ are in a Buyer Advantage Market, while condos priced between $500K and $699K are in a Seller Advantage Market. Multi-family homes are also in a Seller Advantage Market. With respect to single-family homes, those priced from $1.5M to over $4M are in a Buyer Advantage Market.

Beacon Hill Condos

Charlestown: There is a Seller Advantage Market for condos priced at or below $599K or above $1M; all other condo price ranges are in a Buyer Advantage Market. Multifamily homes priced under $500K are in a Balanced Market, while all others find themselves in a Buyer Advantage Market. Single-family homes are predominantly in a Seller Advantage Market.

Jamaica Plain: Condos priced under $249K and between $600K and $699K are in a Balanced Market, as are multi-families priced between $500K and $599K. Condos priced between $700K and $799K are in a Buyer Advantage Market. Condos priced at or above $1M, as well as all single-family homes are in a Seller Advantage Market.

South Boston: All condos are in a Seller Advantage Market, with the exception of those priced between $500K to $599K, which are in a Balanced Market. All multi-families are in a Seller Advantage Market, as are single-family homes priced under $499K. Single family homes priced between $500K and $749K are in a Buyer Advantage Market.

South End: This is currently by far the most popular neighborhood in the city due to its exceptional population diversity, access to 30 city parks and its proximity to some of the finest, newer restaurants and artistic, cultural venues. It comes as no surprise that the South End currently enjoys a Seller Advantage Market for every kind of housing ranging in price from $249K to $1.749M. The exception is single-family homes priced above $1.75M, which remain in a Buyer Advantage Market.

South End Condos

So what does all this mean? Statistics represent aggregated data, and should not be narrowly interpreted to mean that there are no exceptions for specific properties on the market. For example, in a Seller Advantage Market, a particular owner may be flexible on price if there are mitigating circumstances such as a pending relocation, or the pre-purchase of another home. Similarly, in a Buyer Advantage Market there are always going to be sellers who are unreasonably inflexible on their price because they are in no hurry to sell, or didn’t listen to their marketing agent and remain under the misperception that their home is worth far more than it actually is. Hiring a good Marketing Agency (if you are thinking of selling) or Buyer’s Agent is the best way to understand these individual circumstances within the larger context of any neighborhood market conditions.

Interpreting Those Boring Numbers

You may be working with an agent, who like me, recognizes an educated client is a happy client. If not, I offer you some information to chew on. I recognize many of you reading this are qualified to buy (a great thing in this market), but perhaps waiting for property to drop further (a bad thing because you are missing an opportunity to invest in a home and move on with your life).

LINK (Listing Information Network), one of two MLS (Multiple Listing Service) systems that serve the Boston market, recently published their second quarter real estate data. There are lots of juicy details (yes, I’m an economist at heart) that will bore most of you, but the one item of particular interest I would like to share with my clients is, LINKs 2010 Second Quarter Sales Summary.

This Summary information shows a snap shot of Metro Boston neighborhoods, namely Back Bay, Beacon Hill, Charlestown, Fenway, Leather District, Midtown, North End, Seaport, South Boston, South End, Waterfront, and West End. It’s a quick look the following items that are captured: Property Sales, Average Sale Price, Median Sale Price, Average Price Per Square Foot, Median Price Per Square Foot and Days on Market.

Yes, much of the data reported by LINK may seem encrypted, dry and boring, but, like medicine it needs to be taken. The information is important and relevant to those of you seriously buying a home. Ask your REALTOR® to interpret information with you. Review recent sales in a particular neighborhood of interest including active, sold and under agreement. Consider the full picture of all condos in a neighborhood of interest, and then and only then, narrow it down to like property. Compare apples to apples. You will want to review price per square foot of property in a 90 day range. Why? Because unless you buy the home with cash, you will need financing and when you need financing that means a lender will need to get the property appraised. Because property values have dropped and the market is continuously changing, appraisers will review like property (similar living area, bedrooms etc) in a 1-5 mile radius within the past 60-90 days. Reviewing price per square foot by Boston neighborhood should be a point of interest to you and your Realtor when you are buying or selling property. This baseline information helps to compare prices, understand buyer trends and economic activity. There’s more digging your REALTOR® will have to do, but it’s a good starting point.

Another important factor is DOM or rather Days on Market. Typically a high DOM is seen to represent that a property is over priced and while that is some times the case it’s not always the reason. Real estate fact 101 is that any home even one with a rail road track running through it should sell in 30 days. When a home isn’t sold within a 30-45 DOM, it could mean a number of things, including

  • There’s a problem financing the property
  • A buyer made an offer but had problems qualifying (for a loan)
  • The listing agent over priced the property to get the business
  • The seller simply is unreasonable and emotionally charged

Your REALTOR®, particularly in this case a Buyer Agent or Representative, is trained to investigate all these little nuances, like a detective they are versed in digging up important and useful information to present to you. Information you can use to negotiate. Important wouldn’t you agree?

(South Boston) Notable Neighborhood:

The one neighborhood that continues to “rock” is South Boston.  Put another way, South Boston offers the best bargains in town. Compared to other neighborhoods on Link’s 2010 Second Quarter Sales Summary, South Boston homes are priced the lowest and seem to be most active. The price per square foot is $376.60, the Average Sale Price was $363,659. Comparatively speaking, the number of sales are highest at 202 units sold 2nd Quarter 2010.

The average DOM is 72, which tells me agents are pricing units to market or rather this is an indication that the homes in the neighborhood are priced to where/what the consumer is willing to pay. Demand = Supply. The lower the number the quicker the home was sold. Some may argue the area is over developed, however, having investigated many homes for my buyers over the past few months, I’ve observed that availability of condos on the market and quality product are mutually exclusive. Homes are priced competitively and the quality is excellent.

South Boston is a vibrant town with the best of all worlds! It has a neighborhood feel, a small community close to the water and only a few minutes from Back Bay or in another direction to the financial district and the Seaport area. Literally, a short bus ride in any direction.

I hope you find this information useful!

Boston Real Estate Market Updates

I’ve put together a report that outlines the markets and housing types that I primarily deal with, Back Bay, South End and Fenway condominiums and Mission Hill multi-family investment property. The purpose of such a report is to present an unbiased market snapshot and to draw some insightful conclusions based on general knowledge of the markets as well as economic insight.

First, here are some high level data points for Back Bay condominiums gathered earlier today:

Back Bay Condo Statistics

Based on these market statistics the current absorption rate for the Back Bay is 38 weeks, average market time is roughly the same, at 35 weeks. It appears that inventory in the Back Bay is taking longer to sell then historical averages.

Next, a look at South End condominiums:

South End

Based on these market statistics, the current absorption rate for the South End is 21.9 weeks, average market time is slightly lower around 12 weeks. It appears that inventory in the South End is moving quickly compared to other Boston neighborhoods in this report.

And from a condo perspective, let’s finally look at Fenway condominiums:

Fenway Condo Statistics

Based on these market statistics, the current absorption rate for the Fenway is 12 weeks, average market time is lower, around 8 weeks. This leads me to conclude that Fenway inventory is moving at a rapid pace, in fact, faster than any other neighborhood covered in this report. I will expand on this in the conclusion.

And finally, a look at Boston investment property in Mission Hill (Multi-Family Units)

Mission Hill Investment Property Statistics

The absorption rate in Mission Hill is currently at 0. There has been a large amount of inventory to hit the market recently and not much of it is moving. Prices are slightly higher based on 6 month average cap rates which could be a factor; however, it is my belief that financing difficulty and a slow rental market are the key factors in the slowdown of the Mission Hill investment property market.

The market in the above mentioned neighborhoods is still moving and it appears that the lowest end of the price range, The Fenway, is moving the quickest. There are a few factors that contribute to these trends, and I think the most influential is the availability of financing to first time home buyers and financing for non jumbo loans. The greatest pool of buyers seems to be first time buyers and thus the direct correlation with the Fenway having the shortest market time. These figures overlap the expiration of the home buyer tax credit so the true indicator of the validity of this hypothesis will come next month when we see what has happened without the credit in place. If you have any questions on the above figures please feel free to contact me directly and we can discuss – my number is 440-479-0420.

Forbes Predicts Boston Home Prices to Rise 19%

In a recent study conducted by Forbes Magazine, Boston was named the number one city to go from renting to buying.  The study looked at how the premium to buy (the spread between what you’d spend on renting and what you’d pay each month for a mortgage) has decreased across a number of cities, as well as economists prediction of significant home price increases over the next five years.

At the top of the list of cities where buyers should begin to buy is Boston, where economist predict that the home price index will increase by approximately 19% over the next 5 years.

  1. Boston
  2. Charlotte
  3. Chicago

The premium to buy figures are relatively straightforward, however, the home price index increase predictions are a function of the S&P/Case-Shiller Home Price Index, which does carry with it intricacies that are not entirely representative of the downtown Boston condo market (see
Debate Ensues over Case-Shiller Index).

Seller vs. Buyer Advantage by Neighborhood

That the real estate market conditions in Boston continue to ebb and flow is an understatement. You’ve heard time and again that “all real estate is local”, and the current statistics contained herein demonstrate why this is indeed a truism. Any sweeping statement of market conditions in the vast “Boston Real Estate Market” is virtually meaningless. To get a true picture, one has to drill down to look at current neighborhood-specific information. This article looks at current market trends for six (6) Boston neighborhoods: Back Bay, Beacon Hill, Charlestown, Jamaica Plain, South Boston and the South End.

The data referenced herein is based on a 12-month rolling calendar from December 2008 to December 2009 for condos, multi-family homes and single-family homes. Definitions:

  • Seller Advantage Market – there is currently less than a six (6) month supply of homes for sale.
  • Buyer Advantage Market – there is currently more than a six (6) month supply of homes for sale.
  • Balanced Market – there is exactly a six (6) month supply of inventory.

If there is no mention made of a property type within a particular price range, it is because there are no listings within this category. All data was analyzed and compiled by Keller Williams Realty, Boston-Metro from data supplied by LINK (one of two Boston MLS systems).

Back Bay: There is a Seller Advantage Market for condos priced at or below $699K, and a Buyer Advantage Market for condos priced at $700K and higher. A Seller Advantage Market for multi-family homes priced up to $999K converts to a Buyer Advantage Market for those priced at or above $1M. With respect to single-family homes priced between $750K and $999K, this is a Seller Advantage Market. while those priced above $4M fall under the Buyer Advantage Market category.

Beacon Hill: All condos priced at or under $999K are in a Seller Advantage Market. Condos priced at or above $1M are in a Buyer Advantage Market. Multi-family homes priced at or above $1M are in a Buyer Advantage Market. With respect to single-family homes, those priced above $1M are in a Buyer Advantage Market, the exception being single-family homes priced between $1.5M and $1.749M for which there is a Seller Advantage Market.

Charlestown: Condos priced between $250K and $499K, and between $600K and $699K find themselves in a Seller Advantage Market; all other price ranges are in a Buyer Advantage Market. Multifamily homes are in a Seller Advantage Market. Single-family homes under $749K are in a Seller Advantage Market, while those priced between $750K and $999K and between $1.25M and $1.499M are in a Buyer Advantage Market.

Jamaica Plain: All condos, except those priced between $700K and $999K are in a Buyer Advantage Market. Multi-family homes are in a Seller Advantage Market, with the exception of those priced between $500K and $999K, which are in a Balanced Market with exactly a 6-month supply. Single-family homes are layered a bit more multifariously: those priced at or under $499K and between $1.5M and $1.749M are in a Buyer Advantage Market, those priced between $750K and $999K are in a Balanced Market, and those priced at or above $1.75M are in a Seller Advantage Market.

South Boston: All condos priced at or under $499K, are in a Seller Advantage Market, whereas all other condos are in a Buyer Advantage Market. All multi-families are in a Seller Advantage Market, as are single-family homes priced under $499K. Single-family homes priced between $500K and $749K are in a Buyer Advantage Market

South End: Overall, there is a Seller Advantage Market for condos, multi-family homes and single-family homes. The exception is single-family homes priced between $1.75M and $3M, which remains a Buyer Advantage Market.

So what does all of this mean? Statistics represent aggregated data, and should not be narrowly interpreted to mean that there are no exceptions for specific properties on the market. For example, in a Seller Advantage Market, a particular owner may be flexible on price if there are mitigating circumstances such as a pending relocation, or the pre-purchase of another home. Similarly, in a Buyer Advantage Market there are always going to be sellers who are unrealistically inflexible on their price because they are in no hurry to sell, or still unrealistically believe that their home is worth far more than it actually is. Hiring a good Marketing Agent (see Hiring a Marketing Agent to Sell Your Home) or Buyer’s Agent (see Accredited Buyer Representative (ABR) Basics) is the best way to understand these individual circumstances within the larger context of any neighborhood’s market conditions.

Debate Ensues over Case-Shiller Index

LINK, one of the two MLS systems that serve the Boston market, routinely holds a lecture series for its members and guests that cover a wide range of real estate related topics.  The most recent lecture took place at the ultra-luxury Mandarin Oriental in Boston’s Back Bay.  The keynote speaker was Karl Case, one of the founders of the Standard & Poor’s Case-Shiller Home Price Indices, which measure the residential housing market, tracking changes in the value of the residential real estate market in 20 metropolitan regions across the United States.

In essence, the index covers homes that have resold, typically in suburban markets, but does not include condos or new construction sales (only repeat sales).  As Karl Case opened the microphone up for questions following his keynote address, local broker Kevin Ahearn raised the concern that Case’s index does not reflect downtown Boston, as the index does not include condos (the overwhelming majority of downtown Boston’s housing stock) nor new construction sales.  Following the session, Case was quoted as saying that Ahearn “simply doesn’t like anybody who says prices go down – and I say they have”.

It’s rather difficult to take a national or regional trends pitch into the heart of downtown Boston, and while Case suggested that 2010 would be a good year, members of the audience appreciated the message, but realized that the debate highlights the hyper-local nature of real estate, and the potential dangers of aggregating data and drawing conclusions about a local market from regional or national data trends that do not capture  its local nuances.

LINK founder Debra Taylor Blair said the (downtown) Boston condominium market has fared much better than suburban single0family home sales (the latter being what the Case-Shiller index tracks).

Downtown Condo Inventory Up Slightly

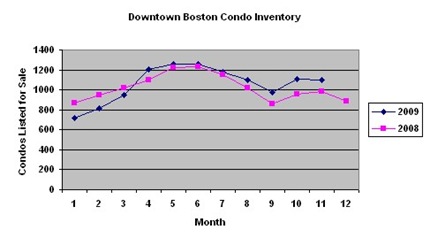
While transaction sales volume in downtown Boston has been off year over year, meaning that there are less condos actually selling in 2009 versus that which sold in 2008, what’s happening to inventory?  Inventory represents the supply of choice that buyers have in the marketplace, and given the economics of the situation, can have an impact on prices as well.

While downtown Boston condo inventory began the 2009 calendar year below 2008 levels, it has tracked very closely with numbers from the previous year.  This trend continued up until August of 2009, when inventory levels did not drop off as substantially as in 2008 – August historically represents the month when inventory levels push down through a post summer dip, which typically lasts through the end of September.

Boston Condo Inventory

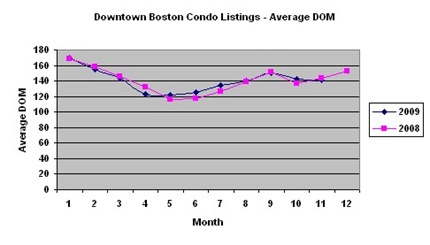
November 2009 condo inventory is up approximately 12% from the same time period in 2008, yet the average days on market (DOM) that a condo is sitting for sale is virtually the same that was experienced in 2008.  By reading between the lines, despite inventory levels being slightly up, transaction sales volume on a percentage basis is actually down more, thus, the absolute number of new listings hitting the market has decreased year over year.  Nonetheless, choice, at least at the superficial level of number of current listings available for sale, is still quite good for buyers.

Average Days on Market

Downtown Boston neighborhoods considered include: Back Bay, Bay Village, Beacon Hill, Chinatown, Financial District, Leather District, Midtown, North End, Seaport District, South Boston, South End, The Fenway, Theatre District, Waterfront, West End

Downtown Boston Luxury Condo Market

As residents anticipate the launch of several new luxury condo buildings in downtown Boston, most notably, the Clarendon Back Bay and the W Boston Hotel & Condos, along with the recent launch of 45 Province, the market for luxury condominiums is poising itself for an influx of additional inventory.

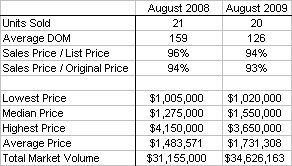
In the face of this influx, data from MLSpin, one of Boston’s two MLS systems, show that the $1 million + condo market year-on-year from July to August has remained somewhat steady in the number of units that sold, along with some increases and decreases across various measures.  On a whole the numbers have stayed relatively similar year over year. 

The data (see below table) demonstrate that there may be a trend beginning to surface in that luxury homes are being priced more aggressively out of the gate (possibly evidenced by a decrease in the highest condo sales price during the period), while still maintaining the sales to list and original price ratios from the previous year. 

luxury-boston-condos

Following the launch of the Clarendon and the W Boston, the city will see a hiatus in the delivery of large-scale condo developments for several years, as the W was the last major development in the city to receive financing before the credit crunch hit the downtown Boston real estate market.  While Buyers have a good assortment of luxury condo inventory to choose from at present, and that pool will grow with the onboarding of the Clarendon and the Boston W, the available choices are now on the table, with no surprises to come for several years.  If a luxury purchase is going to be made, this represents a time to compare  and contrast condos and condo developments to secure a unit that fits the lifestyle and desires of a Buyer, with a relatively low concern that there will be new condo options in the next 3-4 years.

South End Remains Hottest Downtown Neighborhood

The first half 2009 statistics are in, and the South End continues to drive the most unit sales of the major downtown Boston neighborhoods.  According to LINK, one of Boston’s two multiple listing service systems, the South End saw 238 condos sell during the first six months of 2009, ahead of South Boston with 204 condos sold.

Average and median South End condo prices in the first half of 2009 were $597,375 and $518,750 respectively, and average price per square foot across the neighborhood was $575.  The average days that a home sat on the market before selling was 96.  Compared to the previous six months (July through December 2008), the number of listings sold in the South End has taken a drop from 373, however, the other statistics have remained relatively the same, with average and median price at $601,324 and $512,000 respectively, and price per square foot at $588.

South End listings appear to be selling markedly faster than the downtown Boston average of 130 days on the market, but come very close to representing the downtown average and median sales price, $606,738 and $495,896 respectively over the past six months – overall, this represents a slowdown from the previous six months where downtown Boston average and median sales prices were $708,657 and $503,364 respectively.

Across the downtown Boston neighborhoods, the Back Bay continues to drive the highest average sales price and price per square foot at $1,110,356 and $769 respectively.